Ask the business
A professional services firm with a management team of six had more data than it could use. The data was not missing. It was living in four separate places that did not talk to each other, formatted differently in each, with one person acting as the bridge between them.
Every Monday morning, that person spent between forty five minutes and two hours pulling figures together for the weekly management meeting. Revenue by client from the CRM. Project status from the project tool. Utilisation by team member from one spreadsheet. Pipeline from another. Getting those four numbers into one coherent view meant opening four things, exporting from two of them, reformatting the exports, and writing the summary by hand. When a manager asked a follow up question in the meeting, the answer was not ready until the following week.
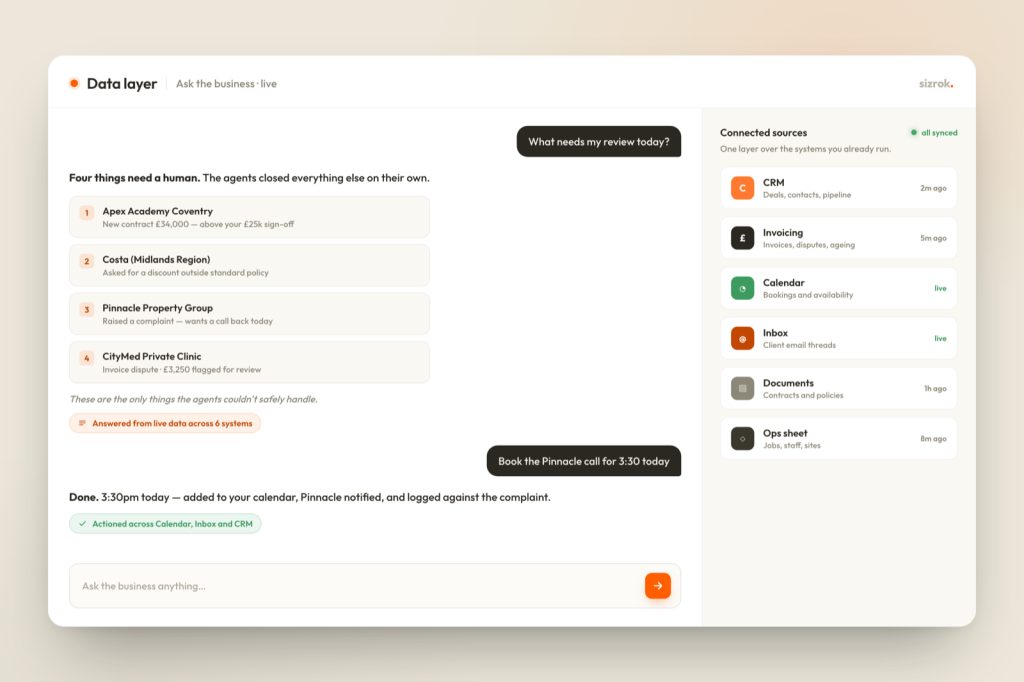
We built them a conversational data layer. The questions that used to take the better part of a morning now take twelve minutes. Any member of the management team can ask one in plain English and get an answer in seconds, with the source data attached. Below: where the data lived, what we built, and what the firm can see now that it could not reach before.
The situation
The firm advises mid market businesses on operations and strategy. It runs on recurring client relationships, with revenue tracked against engagements, utilisation against consultants, and pipeline against the business development team. All of that information exists. It is just not in the same place.
Four systems, none of them connected
Client revenue, engagement status and account history live in HubSpot. Current project status, milestones and time logged live in Asana. A shared Google Sheet holds utilisation, built by hand each week from the Asana exports. A second sheet holds pipeline, kept by the business development lead and updated by hand from the HubSpot notes.
Getting a question like “what is our blended utilisation across active engagements this month” answered meant touching three of those four. A question like “which clients are at risk of not renewing” meant a person building the answer from the raw data by hand. Most questions that crossed more than one system simply did not get asked often enough to matter, because asking them cost too much time.
The cost was not in one big number
The four to five hours the management team spent each week on the same reports was not the whole cost. The bigger cost was the questions that never got asked, the decisions made on feel rather than data, and the version of the business the leadership saw each Monday that was accurate as of last Tuesday’s exports rather than now.
The firm was not data poor. It was data trapped. Everything it needed to run well was sitting in those four systems, but getting to it cost more than most decisions felt worth.
What we built
We did not replace any of their systems. HubSpot stays. Asana stays. Both sheets stay. What we added was a single read only layer that connects to all four, understands how the data relates across them, and answers questions in plain English in the chat tool the management team was already in every day.
One layer, four sources
The layer reads from each source on a set schedule, resolves the inconsistencies, client names spelled differently across systems, date formats that did not match, figures counted differently in each tool, and keeps a clean record of where every figure first came from. Nothing is overwritten. Where two sources disagree, the layer surfaces the disagreement rather than quietly picking a winner.
The answers arrive in Slack, where the team already works. A manager types a question. The layer turns it into a query against the connected sources, runs it, and writes back a plain language answer with the source data attached, in the same thread as everything else, not behind a separate login.
We did not ship a new dashboard for people to remember to open. The team already lived in Slack. Adoption is far easier when the answer arrives where the questions are already being asked.
How a question becomes an answer
The work that matters most is in the translation. Turning a loosely phrased question into the right query against the right combination of sources, without asking the person to know anything about how the data is structured.
From intent to query
A question like “which engagements are running behind this quarter” is not a query. It is an intent. The layer maps it onto the fields it has, decides which sources to touch, and builds a query it can show its working for. If a question is ambiguous, and “which clients are at risk” could mean revenue risk, engagement risk or renewal risk, the layer asks a short clarifying question rather than picking one reading and running with it.
When the answer comes back, it comes back small and checkable. A figure, a short sentence of context, and a link to the source rows. The manager can see exactly which records produced the number. If the answer looks surprising, they can check it in seconds rather than going back to the source system by hand.
The point was never a cleverer dashboard. It was making the right question cost almost nothing to ask.
Trust and the source row
A data layer the team does not trust is just a faster way to be wrong. The single most important design decision was this. Every answer cites the source data. Not a reference to which system the figure came from, the actual rows the layer used to produce the answer, one click away.
Every answer is checkable
If the layer says blended utilisation this month is 73 percent, it shows the time logged records it counted. If it reports pipeline value by practice area, it links to the HubSpot deals it summed. The management team can always drop from the summary to the evidence.
This built trust faster than anything else. In the first few weeks team members checked almost every answer against the source. The rows lined up. Over time the checks got less frequent, not because the team stopped caring but because the habit was set and the layer had earned the confidence. The citation is what let it earn its way into real decisions rather than sitting beside them as a curiosity.
What changed
The Monday report used to take the best part of a morning for one person, and arrived in the meeting as a PDF nobody could interrogate. It now takes twelve minutes, because the questions that make it up are answered in the Slack thread as fast as they can be typed, each with its source data attached.
Self serve across the team
The bigger change is quieter and harder to put a number on. Self serve has spread across the management team. Questions that used to need a request to the person who did the exports are now asked directly, by whoever has them. Questions too small to be worth a morning of manual work are now asked daily.
The person who used to own the reports still owns the data layer. They now spend their time improving it, adding sources, handling the edge cases, building the set of saved questions the team returns to each week, rather than acting as a human query engine for everyone else.
The firm can now answer questions it was not asking before. Not because the data changed, but because getting to it no longer costs more than the decision is worth.
Where it goes next
The layer was scoped to be owned by the client. Every connection, every prompt, every configuration was transferred on the day it went live. The team can add a source, save a new recurring question, or change how an ambiguous term is read, without us.
The natural extensions are straightforward. New tools as the firm’s stack changes, scheduled answers that arrive each Monday without anyone asking, and a small set of saved questions the whole team has to hand. None of those need building now. The layer does its current job well, and the team will extend it when they are ready.
What mattered most was closing the gap between the data the firm already had and the decisions it was making without it.